Latest Table Update: August 8, 2020 (Table below text)
Some say the coronavirus is just like the flu. Is it? The answer is that while there are similarities, no, the coronavirus is not like the flu. It is different in many important ways. The main difference is the fact that when it spread in early 2020 in the Western world, people did not have immunity to the coronavirus because it was brand new and there is still no vaccine against it. No reason to panic but we should be cautious. The most similar virus based on the RNA sequence is SARS not influenza. The risk to children is moderate for coronavirus but is high for influenza. The mortality rate for coronavirus is much higher than influenza and varies between countries. The mortality rate in August 2020 was (5.3% in China) (14% in Italy) (2% in South Korea) (3.3% in USA), while for influenza it is 0.1% as measured in the 2018-2019 influenza season. The risk for the elderly is about 20% higher for coronavirus. The time that people who are infected with coronavirus remain infectious or contagious is 17-24 (middle 50%) while for influenza it is 8 days. Coronavirus survives on surfaces for up to 9 days while the flu virus only 2 days. On May 1 2020, the FDA issued an emergency use authorization (EUA) for the investigational antiviral drug remdesivir for the treatment of COVID-19. On June 15 2020, the FDA revoked the EUA for drug Hydroxychloroquine as a drug to treat coronavirus infections due to risk of heart rhythm problems.
The numbers in this table will be updated as new data is reported by reputable organizations such as the World Health organization (WHO) and Center for Disease Control (CDC) of countries that are funding and managing them well.
| Variable | Coronavirus | Influenza | C* | Date of Ref | Ref |
| Existing immunity to virus in the population | None in early 2020. By end of April 2020: 15-21% in NYC, 2-4% elsewhere. | Yes | 5 | 03/20/2019 and 11/18/2019 and 4/28/2020 | ScienceDaily and CDC-7 and John-Hopkins-2 |
| Vaccine | No | Yes | 5 | 7/2/2020 | FDA-2 and FDA-3 |
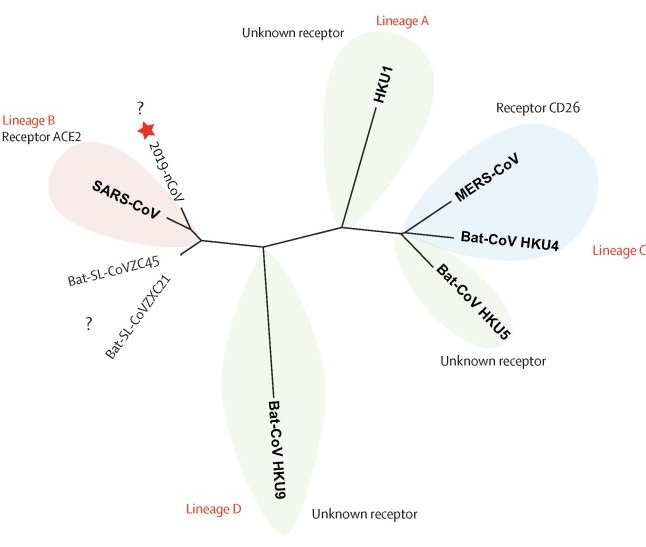
| Most similar virus1 | SARS | A(H1N1) and A(H3N2) | 5 | 02/22/2020 and 11/18/2019 | Roujian Lu et al 2020 and CDC-7 |
| Drugs to treat infection | Remdesivir | Tamiflu (oseltamivir phosphate) and others | 5 | 5/1/2020 and 04/22/2019 | FDA-1 and CDC-12 |
| Death Risk to children | Less than adults | High | 4 | 07/21/2020 and 06/04/2019 | CDC-5 and Healthline |
| Death Risk to people between 18 and 50 | Moderate | High | 5 | 02/25/2020 and 06/04/2019 | WHO-1 and Healthline |
| Death Risk to people over 50 | High | High | 5 | 02/25/2020 and 06/04/2019 | WHO-1and Healthline |
| Death Risk to Pregnant women | Similar to Non-pregnant | High | 5 | 08/6/2020 and 06/04/2019 | CDC-15 and Healthline |
| Native American or Native Alaskan ancestry | High | High | 5 | 06/04/2019 and 08/07/2020 | Healthline and HIS-1 |
| Mortality Rate | (5.3% in China) (14% in Italy) (2% in South Korea) (3.3% in USA) | 0.1% | 3 | 02/25/2020, and 8/8/2020 | CDC-1 and John Hopkins-1 |
| Mortality Rate people over 80 | 14.8-21.9% | 0.83% | 5 | 02/25/2020 and 01/08/2020 | WHO-1 and CDC-1 |
| Male/Female Mortality Rate for elderly | M > F (China) | M > F (USA) | 3 | 02/25/2020 and July 2010 | WHO-1 and WHO-3 |
| Average # Deaths A Year Globally | 722,835 (First year, as of 8/8/2020) | 389,000 (average) | 5 | 3/20/2020 and 10/22/2019 | John Hopkins-1 and Paget et al 2019 |
| Distance and method of Transmission | Aerosol, touching surfaces, cough, sneeze, talk droplets, 6-13 feet away | Cough, sneeze or talk droplets, 6 feet away | 4 | 4/2/2020 and 4/10/2020 and 8/27/2018 | Nature and CDC-13 and CDC-14 |
| Period of Contagiousness2 | ~17-24 days (IQR4) | ~8 days (pre-and post-illness) | 4 | 03/11/2020 and 09/13/2019 and 12/11/2012 | Zhou et al 2020 and CDC-3 and Suess et al 2012 |
| Time virus survives on inanimate surfaces | 9 days | 2 days | 5 | 02/06/2020 and 07/31/2018 | Kampf et al 2020 and CDC-11 |
| Viral Load3 | A median of 7·99 × 104 copies/mL in throat samples and 7·52 × 105 in sputum samples | >104 copies/mL throat | 4 | 02/24/2020 and August 2010 (for H1N1) | Yang Pan et al 2020 and CDC-8 |
| Duration of Viral Load > 0 in recovering persons (including before onset of symptoms) | ~10 days | ~10 days | 2 | 02/24/2020 and August 2010 (for H1N1) and 12/11/2012 | Yang Pan et al 2020 and CDC-8 and Suess et al 2012 |
| Does asymptomatic or pre-symptomatic Viral load > 0 occur? | Yes | Yes | 5 | 02/24/2020 and August 2010 (for H1N1) and 12/11/2012 | Yang Pan et al 2020 and CDC-8 and Suess et al 2012 |
| Incubation period | 1-14 days (median 5 days) | 1-4 days | 5 | 02/25/2020, 09/13/2019, 03/10/2020 | WHO-1 and CDC-3 and Lauer et al 2020 |
| Time from symptom onset to recovery (TSTR) for mild cases | 2 weeks | 3-7 days | 5 | 02/25/2020 and 03/08/2019 | WHO-1 and CDC-9 |
| TSTR for severe or critical disease | 3-6 weeks | NA | 5 | 02/25/2020 | WHO-1 |
| Reproductive rate of infection (R0) in China | 2-2.5 | 1.53 | 4 | 02/25/2020 and Sept 2019 | WHO-1 and Xiaofang et al 2019 |
| R0 worldwide | NA | 1.2-1.6 ((H1N1) 2009 | – | 09/20/2009 | WHO-2 |
| R0 in the Diamond Princess cruise ship without intervention | 14.8 | NA | 3 | 02/28/2020 | Rocklöv et al 2020 |
| R0 in the Diamond Princess cruise ship with isolation and quarantine | 1.78 | NA | 3 | 02/28/2020 | Rocklöv et al 2020 |
| Source of virus | Bats and pangolins | Pigs or birds, (some circulate continuously around the world between epidemics) | 5 | 02/25/2020 and 01/24/2018 and 07/01/2020 | WHO-1 and WebMD and Li et al 2020 |
| Signs and symptoms in critical cases | Fever or chills, Cough, Shortness of breath or difficulty breathing, Fatigue, Muscle or body aches, Headache, Loss of taste or smell, Sore throat, Congestion or runny nose, Nausea or vomiting, Diarrhea | Fever* or feeling feverish/chills, Cough, Fatigue (tiredness), Muscle or body aches, Headaches, Sore throat, Runny or stuffy nose, Some people may have vomiting and diarrhea, though this is more common in children than adults. | 5 | 02/25/2020, and 09/18/2019 and 05/13/2020 | WHO-1 and CDC-2 and CDC-4 |
| Signs and symptoms in mild or otherwise asymptomatic cases | Loss of smell and taste in infected people with no other symptoms | 2 | 3/22/2020 | AAO-HNS-1 | |
| Does season & humidity affect transmission? | Unknown | Yes | 4 | 03/04/2020 | Harvard School of Public Health |
| Rate of evolution or subst/site/year | 0.92×10⁻³ (2 mutations per month) | 1.8 × 10⁻³ to 2.2 × 10⁻³ (A) and 0.45 × 10⁻³ to 0.8 × 10⁻³ (B) | 5 | 03/06/2020 and 01/13/2006 | Rambaut 2020 and Nobusawa et Sato 2006 |
| Length of RNA Genome | ~30,000 | ~ 13,500 | 5 | 03/09/2020 and 10/15/2019 | Roujian Lu et al 2020 and CDC-10 |
*Confidence C is listed for COVID-19 facts on a scale of 1(lowest) to 5 (highest), based on the sources and unanimity of facts. Influenza facts do not need a confidence scale as the virus has been well studied over many years.
1 Most similar virus is determined through phylogenetic analysis which compares the RNA sequence of the virus with sequences of other viruses using phylogenetic methods
2Period of Contagiousness is also the duration of viral shedding and is measured by the viral load.
3Viral load (defined in Glossary of Terms below) is usually not measured during diagnosis or treatment. It is most often measured during outbreaks or clinical studies. That is why the influenza data available is from the 2009 H1N1 outbreak.
4IQR : interquartile range is the difference between the first and third quartile also called the middle 50% (around the median).
Figures
Figure 5 from Roujian Lu et al 2020 : Phylogenetic analysis and homology modelling of the receptor-binding domain of the 2019-nCoV, SARS-CoV, and MERS-CoV
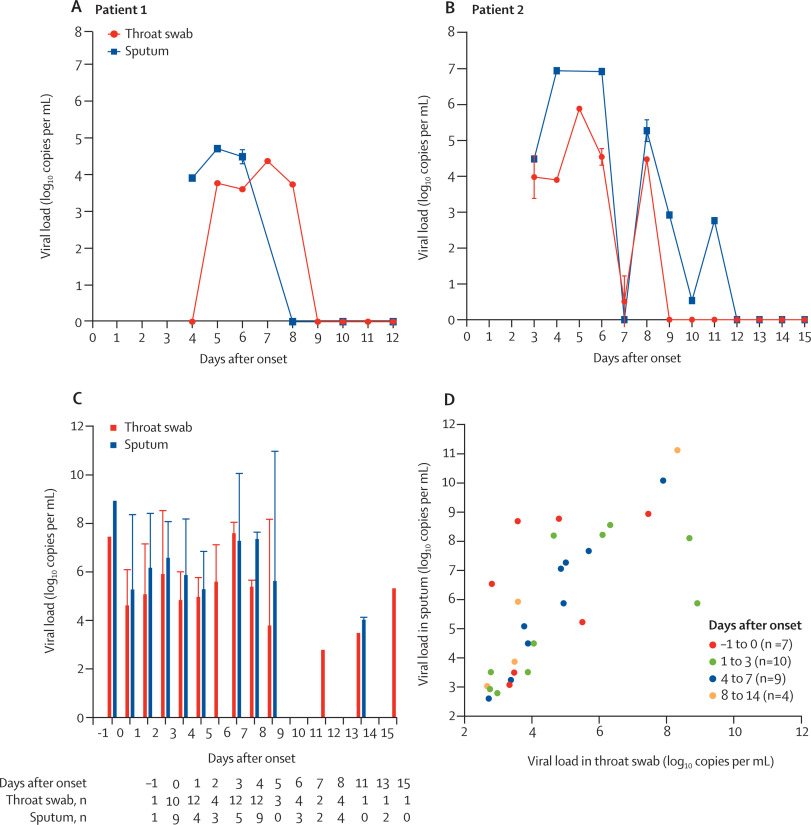
Figure from Yang Pan et al 2020 showing viral load charts of COVID-19
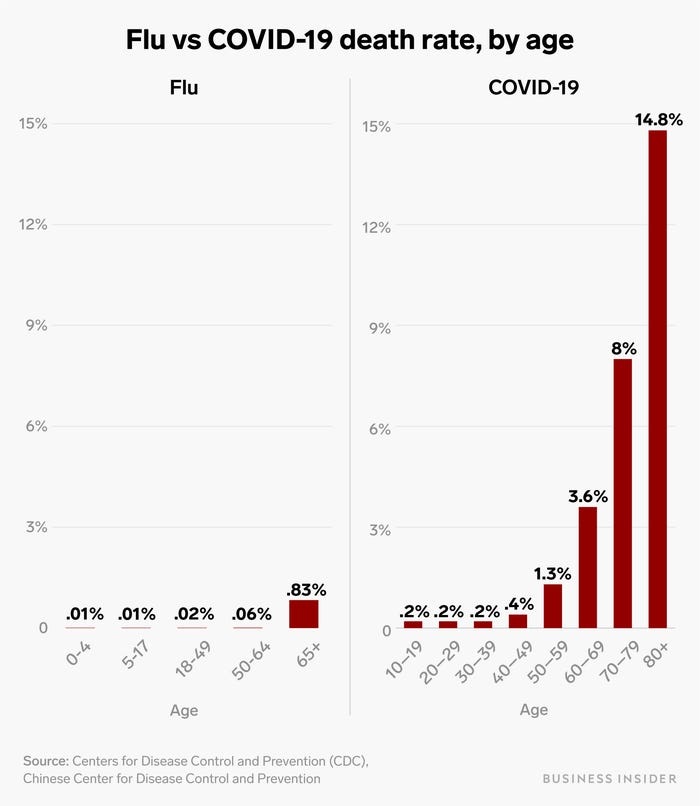
Figure showing how the death rates of the two viruses compare in different age brackets. Ruobing Su/Business Insider (March 4 2020)
Tables
| Virus | Case Fatality Rate (%) | R0 |
| 2019-nCoV | 3 | 1.4–5.5a |
| SARS-CoV | 10 | 2–5 |
| MERS-CoV | 40 | <1 |
| Avian H7N9 (2013) | 40 | <1 |
| H1N1 (2009) | 0.03 | 1.2–1.6 |
| H1N1 (1918) | 3 | 1.4–3.8 |
| Measles Virus | 0.3 | 12–18 |
| Rhinovirus | <0.01 | 6 |
| Ebola Virus | 70 | 1.5–2.5 |
| HIV | 80b | 2–4 |
| Small Pox Virus | 17 | 5–7 |
a WHO: 1.4–2.5; S. Zhao et al.: 3.3–5.5; J. Read et al.: 3.6–4.0; M. Shen et al.: 4.5–4.9.
b Without therapy.
Table 1 from Chen 2020. Case fatality rate and R0 value of commonly known emerging virus infections.
Glossary of Terms
Immunity: the ability to resist a particular infection or toxin by the action of specific antibodies or sensitized white blood cells
Incubation period: the period between exposure to an infection and the appearance of the first symptoms
Phylogenetics: is the study of evolutionary relationships among biological entities – often species, individuals or genes
Rate of evolution: This rate is also called mutation rate and it is usually measured as the number of substitutions by nucleotide site in a year (subst/site/year)
Reproductive rate of infection (R0): is defined as the expected number of secondary cases produced by a single (typical) infection in a completely susceptible population.
Viral load: The measurement of the amount of a virus in an organism, typically in the bloodstream, usually stated in virus particles per milliliter.
Viral shedding: refers to the expulsion and release of virus progeny following successful reproduction during a host-cell infection. During viral shedding a person is contagious